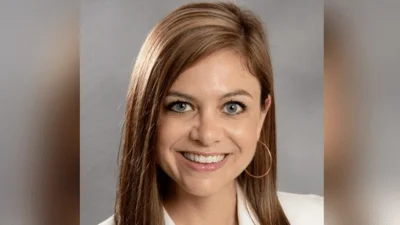
Dr. Cade Brumley Louisiana State Superintendent of Education | https://www.nsula.edu
Dr. Cade Brumley Louisiana State Superintendent of Education | https://www.nsula.edu
Of all the students welcomed in the 2023-24 school year, 50.9% of them were boys, and 49.1% were girls.
Data also showed that Black students made up 50.5% of the student body, the largest percentage in the parish, followed by 42.1% white students, 3.8% Hispanic students and 1.3% Asian students.
West Monroe High School had the highest enrolment among Ouachita Parish's schools in the 2023-24 school year, welcoming 2,019 students.
According to a 2023 Scholaroo study, Louisiana's education system ranked 49th in the U.S., only ahead of Arizona. The state ranked poorly in key metrics such as school quality, student achievement, and student safety.
| School name | Total enrollment in 2022-2023 | Total enrollment in 2023-2024 | % change |
|---|---|---|---|
| West Monroe High School | 2,032 | 2,019 | -0.6% |
| Ouachita Parish High School | 1,105 | 1,126 | 1.9% |
| Neville High School | 1,031 | 1,041 | 1% |
| West Ouachita High School | 1,019 | 976 | -4.2% |
| Sterlington Elementary School | 791 | 769 | -2.8% |
| Claiborne School | 712 | 721 | 1.3% |
| West Ridge Middle School | 617 | 677 | 9.7% |
| Wossman High School | 592 | 622 | 5.1% |
| Lexington Elementary School | 583 | 559 | -4.1% |
| Sallie Humble Elementary School | 574 | 587 | 2.3% |
| Good Hope Middle School | 563 | 560 | -0.5% |
| Carroll High School | 560 | 561 | 0.2% |
| Jack Hayes Elementary School | 552 | 533 | -3.4% |
| Lakeshore School | 548 | 537 | -2% |
| Woodlawn Elementary School | 534 | 508 | -4.9% |
| East Ouachita Middle School | 520 | 492 | -5.4% |
| Drew Elementary School | 516 | 531 | 2.9% |
| Sterlington High School | 514 | 534 | 3.9% |
| Calhoun Elementary School | 506 | 468 | -7.5% |
| Kiroli Elementary School | 480 | 482 | 0.4% |
| Richwood High School | 466 | 435 | -6.7% |
| Calhoun Middle School | 463 | 434 | -6.3% |
| Robert E. Lee Junior High School | 461 | 443 | -3.9% |
| J. S. Clark Magnet Elementary School | 453 | 468 | 3.3% |
| George Welch Elementary School | 452 | 447 | -1.1% |
| Cypress Point Elementary School | 440 | 442 | 0.5% |
| Riser Middle School | 426 | 448 | 5.2% |
| Central Elementary School | 422 | 445 | 5.5% |
| Roy Neal Shelling Senior Elementary School | 413 | 428 | 3.6% |
| Sterlington Middle School | 410 | 400 | -2.4% |
| Minnie Ruffin Elementary School | 408 | 388 | -4.9% |
| Ouachita Junior High School | 398 | 341 | -14.3% |
| Robinson Elementary School | 387 | 375 | -3.1% |
| Swartz Lower Elementary School | 376 | 361 | -4% |
| Swartz Upper Elementary School | 366 | 365 | -0.3% |
| Carver Elementary School | 351 | 393 | 12% |
| Richwood Junior High School | 348 | 320 | -8% |
| Berg Jones Elementary School | 341 | 369 | 8.2% |
| Martin Luther King Junior High School | 326 | 316 | -3.1% |
| Madison James Foster Elementary School | 325 | 304 | -6.5% |
| Carroll Junior High School | 323 | 356 | 10.2% |
| Riser Elementary School | 307 | 297 | -3.3% |
| Riverbend Elementary School | 307 | 262 | -14.7% |
| Woodlawn Middle School | 302 | 259 | -14.2% |
| Lenwil Elementary School | 285 | 287 | 0.7% |
| Highland Elementary School | 285 | 280 | -1.8% |
| Boley Elementary School | 271 | 271 | 0% |
| Clara Hall Accelerated School | 265 | 280 | 5.7% |
| Barkdull Faulk Elementary School | 255 | 236 | -7.5% |
| Thomas Jefferson Elementary School | 231 | 240 | 3.9% |
| Shady Grove Elementary School | 230 | 212 | -7.8% |
| New Vision Learning Academy | 204 | 228 | 11.8% |
| Crosley Elementary School | 201 | 206 | 2.5% |
| Swayze Elementary School | 197 | 192 | -2.5% |
| Pinecrest Elementary/Middle School | 189 | 175 | -7.4% |
| Sherrouse School | 182 | 159 | -12.6% |
| Southside Alternative High School | 121 | 108 | -10.7% |


 Alerts Sign-up