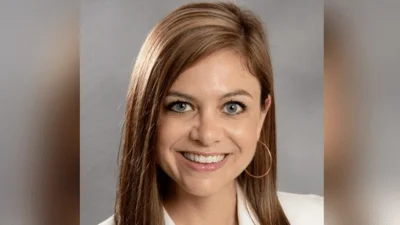
Dr. Cade Brumley Louisiana State Superintendent of Education | X
Dr. Cade Brumley Louisiana State Superintendent of Education | X
Of the 26,273 students attending Ouachita Parish schools, 50.5% were Black. White students were the second largest ethnicity, making up 42.1% of Ouachita Parish students.
In the previous school year, Black was also the most common student ethnicity in Ouachita Parish, representing 50.3% of the student body.
Riser Elementary School had the most even distribution of races among the county schools, which included 42.1% Black students, 26.6% white students, 23.6% Hispanic students, 6.1% multiracial students, 1% Asian students, 0.3% Hawaiian or Pacific Islander students, and 0.3% American Indian students.
Compared to the previous year, total enrollment in public schools in the county dropped by 1% in the 2023-24 school year
The majority of Louisiana students identified themselves as white and Black, representing 48% and 37% of the state student body respectively during the 2021-22 academic year. Hispanic students made up 8.6% of the student body, and other ethnic minorities made up 5.6%.
However, the teaching staff in Louisiana doesn't fully mirror the student body's demographics, with only 22% of teachers identified as Black or Latino.
| School name | Most prevalent ethnicity | Percent of Total Student Body | Total Enrollment |
|---|---|---|---|
| West Monroe High School | White | 65.3% | 2,019 |
| Ouachita Parish High School | Black | 73.2% | 1,126 |
| Neville High School | Black | 59.8% | 1,041 |
| West Ouachita High School | White | 89.5% | 976 |
| Sterlington Elementary School | White | 72.6% | 769 |
| Claiborne School | White | 72.8% | 721 |
| West Ridge Middle School | White | 75.8% | 677 |
| Wossman High School | Black | 98.1% | 622 |
| Sallie Humble Elementary School | White | 50.1% | 587 |
| Carroll High School | Black | 97.3% | 561 |
| Good Hope Middle School | White | 70% | 560 |
| Lexington Elementary School | White | 51.7% | 559 |
| Lakeshore School | Black | 62.9% | 537 |
| Sterlington High School | White | 74.5% | 534 |
| Jack Hayes Elementary School | Black | 88.7% | 533 |
| Drew Elementary School | White | 88.3% | 531 |
| Woodlawn Elementary School | White | 93.5% | 508 |
| East Ouachita Middle School | Black | 55.3% | 492 |
| Kiroli Elementary School | White | 77.6% | 482 |
| J. S. Clark Magnet Elementary School | Black | 96.8% | 468 |
| Calhoun Elementary School | White | 91% | 468 |
| Riser Middle School | Black | 51.3% | 448 |
| George Welch Elementary School | White | 87% | 447 |
| Central Elementary School | White | 88.5% | 445 |
| Robert E. Lee Junior High School | Black | 65.2% | 443 |
| Cypress Point Elementary School | Black | 87.8% | 442 |
| Richwood High School | Black | 97.7% | 435 |
| Calhoun Middle School | White | 88.2% | 434 |
| Roy Neal Shelling Senior Elementary School | Black | 97.7% | 428 |
| Sterlington Middle School | White | 72.8% | 400 |
| Carver Elementary School | Black | 97.5% | 393 |
| Minnie Ruffin Elementary School | Black | 97.9% | 388 |
| Robinson Elementary School | Black | 95.5% | 375 |
| Berg Jones Elementary School | Black | 98.6% | 369 |
| Swartz Upper Elementary School | Black | 45.8% | 365 |
| Swartz Lower Elementary School | White | 48.2% | 361 |
| Carroll Junior High School | Black | 98.3% | 356 |
| Ouachita Junior High School | Black | 88.3% | 341 |
| Richwood Junior High School | Black | 96.2% | 320 |
| Martin Luther King Junior High School | Black | 97.8% | 316 |
| Madison James Foster Elementary School | Black | 100% | 304 |
| Riser Elementary School | Black | 42.1% | 297 |
| Lenwil Elementary School | White | 49.1% | 287 |
| Clara Hall Accelerated School | Black | 97.9% | 280 |
| Highland Elementary School | White | 70.7% | 280 |
| Boley Elementary School | Black | 53.1% | 271 |
| Riverbend Elementary School | Black | 72.5% | 262 |
| Woodlawn Middle School | White | 94.2% | 259 |
| Thomas Jefferson Elementary School | Black | 97.9% | 240 |
| Barkdull Faulk Elementary School | Black | 94.1% | 236 |
| New Vision Learning Academy | Black | 100% | 228 |
| Shady Grove Elementary School | Black | 95.3% | 212 |
| Crosley Elementary School | White | 50.5% | 206 |
| Swayze Elementary School | Black | 100% | 192 |
| Pinecrest Elementary/Middle School | White | 96% | 175 |
| Sherrouse School | Black | 89.9% | 159 |
| Southside Alternative High School | Black | 79.6% | 108 |
ORGANIZATIONS IN THIS STORY
!RECEIVE ALERTS
DONATE


 Alerts Sign-up